
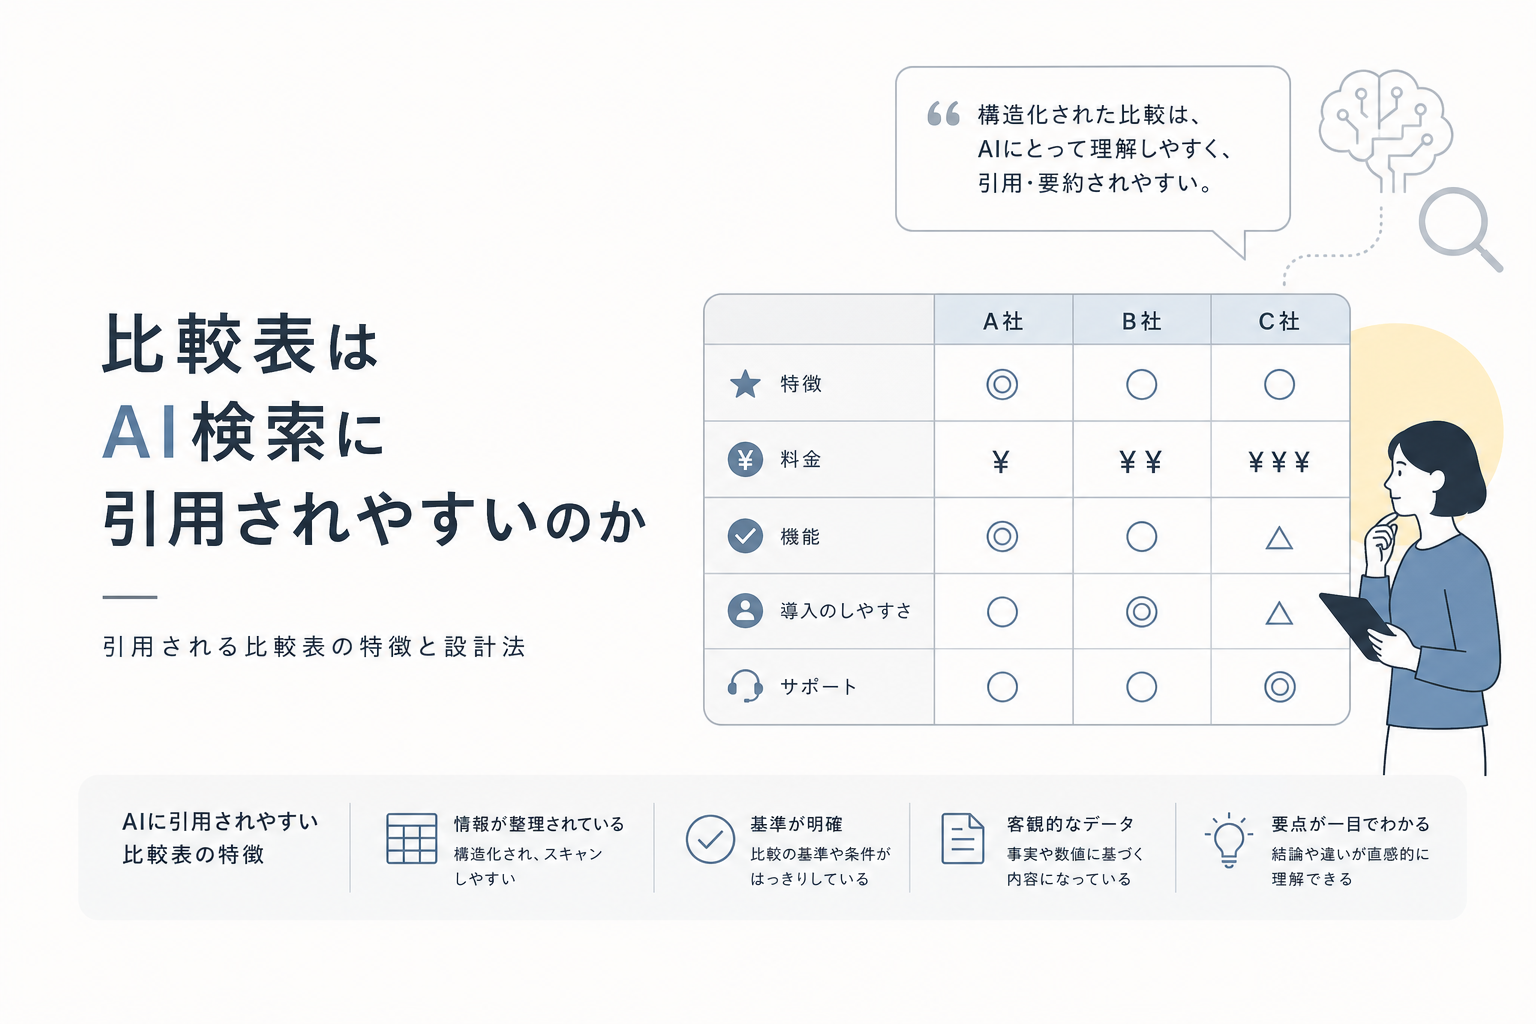
Comparison tables are a highly quotable content format in AI search (such as AI Overview and LLMO). AI tends to prioritize extracting "structured information that supports user decision-making," and comparison tables that are clearly defined by comparison axes, written in HTML table tags, and concise with 1-2 sentences per cell are more likely to be adopted as the basis for AI responses. However, it is a prerequisite to redesign them as "comparison tables for decision-making materials" rather than mere functionality checklists.
Author Information
LLMO navi Editorial Team | A specialized media for AI search optimization (LLMO). We explain design methods for content to be quoted by AI search engines like AI Overview and Perplexity based on practical data.
What Does It Mean for AI Search to "Quote Comparison Tables"?
In AI search, quoting refers to the AI extracting specific paragraphs or tables from web information sources and incorporating them into responses for users.
When a comparison table is quoted, the AI uses "specific rows, columns, or cells" rather than the entire table. Therefore, it is essential that the table is designed to make sense on its own.
There are three reasons why AI prefers comparison tables:
- It can directly answer user decision-making queries like "Which is better, A or B?"
- Information is organized in rows and columns, making it easy to summarize and restructure.
- If conclusions or evaluations are clearly stated, it is easier to quote them as the basis for responses.
By designing comparison tables while keeping in mind the basic knowledge of AI search countermeasures, the likelihood of being quoted increases further.
Why Aren't All Comparison Tables Quoted by AI Search?
There is a clear design difference between comparison tables that are quoted by AI and those that are not.
Traditional functionality checklists are often excluded from being quoted because it is unclear to the AI "what criteria should be used for judgment."
Characteristics of Comparison Tables That Are Not Quoted
- Only functionality names and checkmarks are listed.
- The comparison axes (what is being compared) are unclear.
- Prerequisites (company size, use case, industry) are not stated.
- Tables are presented as images or PDFs.
Characteristics of Comparison Tables That Are Quoted
- The comparison axes are narrowed down to 5-7.
- Each cell is described concisely in 1-2 sentences.
- The conclusion about "which companies are suitable" is clearly stated.
- It is written using HTML table tags.
This difference is due to the "quality of decision-making materials" rather than the "amount of information."
Five Conditions for AI Search to Evaluate Comparison Tables
The conditions that AI prioritizes when quoting comparison tables can be summarized into five points.
Condition 1: It Should Be in a Short and Reusable Format
It is crucial that the comparison axes and prerequisites are clearly organized so that the AI can extract parts and still convey meaning.
For example, comparison tables of monthly costs and support ranges for the 2026 edition, or implementation costs for companies with fewer than 100 employees, are typical examples that are easy to reuse due to their clear prerequisites.
When differences between contract types, such as annual and monthly contracts, are consolidated into one table, the AI can extract parts without losing context.
Condition 2: It Includes Clear Conclusions or Evaluations
It is necessary to make it immediately clear which service is superior or which type of person it is suitable for.
Specifically, conclusions like the following should be clearly stated in or just below the table:
- If cost is a priority, Company A is optimal; if functionality is a priority, Company B is optimal.
- Company A, with the most implementation records, is suitable for large organizations.
- Company C, with a satisfaction rate of 95% in the 2025 evaluation, is recommended.
- Company D, which requires no setup, is suitable for beginners.
Comparison tables without conclusions cannot be used by AI because it cannot determine "what to use for the response," thus they are excluded from being quoted.
Condition 3: It Is Written in HTML Table Tags
It is essential that it is written in a machine-readable HTML format, not as images or PDFs.
| Implementation Element | Recommended Content |
|---|---|
| table tag | Create specification comparison tables using the table tag. |
| thead tag | Clearly define the header row. |
| td tag | Input accurate values into data cells. |
| Accessibility | Add caption elements and scope attributes. |
Comparison tables that are presented as images cannot be read by AI crawlers, resulting in a quoting rate of almost 0%.
Condition 4: Structured Data Is Implemented
Using schema.org and other tools to correctly convey data structure to search engines improves the accuracy of AI quoting.
- Defining product information using Product schema.
- Adding structured data for 2026 edition pricing information.
- Embedding rating scores (AggregateRating).
- Optimizing questions using FAQ structured data.
By implementing structured data, AI can accurately identify which columns represent "price" and which represent "features."
Condition 5: The Comparison Axes Are Directly Related to Decision-Making
Comparison axes based on performance data, such as average operating rates over the past three years, are easier for AI to quote as "reliable decision-making materials."
Practical comparison axes like the following are effective, rather than just the presence or absence of features:
- Time and effort required for implementation.
- Operational load (monthly management effort).
- Compatibility with existing systems.
- Scope and response time of support systems.
Before/After of Comparison Tables: Functionality Checklists vs. Decision Axis Comparison Tables
Let's look at specific examples to confirm the differences between poor and good comparison tables.
Poor Example: Functionality Checklist
| Functionality | Company A | Company B | Company C |
|---|---|---|---|
| Chat | Available | Available | Not Available |
| API Integration | Available | Not Available | Available |
| Report | Available | Available | Available |
This table cannot convey to users "which company to choose" even if quoted by AI.
Good Example: Decision Axis Comparison Table
| Comparison Axis | Company A | Company B | Company C | Company D |
|---|---|---|---|---|
| Monthly Cost (for companies with fewer than 100 employees) | Sets a low price range for companies with fewer than 100 employees. | Mid to high price range due to a focus on functionality. | Mid price range based on a satisfaction rate of 95%. | Offers a free plan for beginners. |
| Suitable Companies | Large organizations (most implementation records). | Companies needing functionality customization. | Emphasizes balance between cost and quality. | Companies wanting immediate use without setup. |
| Difference Between Annual and Monthly Contracts | Functionality differences exist with annual contracts (features unlocked for higher plans). | No differences based on contract type. | 10% discount for monthly payments with annual contracts. | Only available for monthly contracts. |
| Support Scope | Dedicated representative included. | Email support only. | Chat + phone support. | FAQ site only. |
| Conclusion | If cost is a priority, Company A is optimal. | If functionality is a priority, Company B is optimal. | Company C, with a satisfaction rate of 95% in the 2025 evaluation, is recommended. | Company D, which requires no setup, is suitable for beginners. |
The decision axis comparison table allows AI to directly quote conclusions like "If cost is a priority, Company A."
Design Steps for Comparison Tables: Five Steps
We will explain specific design steps to optimize comparison tables for AI quoting.
Step 1: Identify User Decision-Making Queries
The design of the comparison table begins with identifying "what the user is comparing."
- What are the differences between Company A and Company B?
- Which is suitable for companies with fewer than 100 employees?
- How does it change between annual and monthly contracts?
Select comparison axes that can answer these queries.
Step 2: Narrow Down Comparison Axes to 5-7
If there are too many comparison axes, the AI cannot filter information during extraction. The optimal number is 5-7.
- Monthly cost
- Suitable company size
- Functionality differences based on contract type
- Support scope
- Average operating rate over the past three years
- Implementation period
- Compatibility with existing systems
Step 3: Describe Each Cell in 1-2 Sentences
Each cell should be concise, allowing the AI to extract and use the information easily.
Items that require longer explanations should be included as supplementary paragraphs below the table.
Step 4: Always Add a Conclusion Row
Include a "Conclusion" row at the bottom of the table.
Make it a one-sentence statement that concludes the judgment, such as "If cost is a priority, Company A is optimal; if functionality is a priority, Company B is optimal."
Step 5: Implement Using HTML Table Tags
Ensure the specification comparison table is created using the table tag, the header row is clearly defined using the thead tag, accurate values are input into the td tags, and the table structure considers accessibility.
Is the Comparison Table Enough? Three Elements to Reinforce in the Text
Comparison tables alone are insufficient, and reinforcement through text significantly affects AI quoting rates.
Reinforcement 1: Explain How to Read the Comparison Axes
Just looking at the "monthly cost" column does not clarify whether it is the implementation cost for companies with fewer than 100 employees or the total company implementation cost.
Clearly state the prerequisites for each comparison axis in the text to prevent misinterpretation by AI.
Reinforcement 2: Clearly State Prerequisites
Include prerequisites just before the table, such as:
- This is a comparison based on the monthly costs and support ranges for the 2026 edition.
- It assumes companies with fewer than 100 employees.
- If there are functionality differences between annual and monthly contracts, they are clearly stated in the table.
Reinforcement 3: Provide Links to Related Pages
Establish pathways in the text that lead to the next actions, such as improvement measures for site design that gets quoted by AI.
How to Implement Structured Data in Comparison Tables
Implementing structured data is a technical response necessary for AI to accurately understand the meaning of the table.
Define product information using Product schema and markup the name, price, and rating of each product in a machine-readable format.
| Type of Structured Data | Usage | Implementation Example |
|---|---|---|
| Product | Definition of product information | Describe name, price, and category |
| AggregateRating | Embedding rating scores | Structure numerical values like satisfaction rate of 95% |
| Offer | 2026 edition pricing information | Describe monthly and annual costs |
| FAQPage | FAQ structured data | Define pairs of questions and answers |
By designing structured data after understanding how Google's AI mode works, the accuracy of AI extraction improves.
Template for Comparison Axes That BtoB Companies Should Focus On
In BtoB comparison tables, "practical information necessary for implementation decisions" is prioritized over feature comparisons.
As discussed in B2B companies' LLMO practical strategies, AI prioritizes extracting "information that supports decision-making."
| Comparison Axis Category | Examples of Specific Axes |
|---|---|
| Cost | Monthly cost (for companies with fewer than 100 employees) |
| Contract Conditions | Functionality differences between annual and monthly contracts |
| Performance | Average operating rate over the past three years |
| Support | Support scope (presence of dedicated representatives) |
| Suitability | Suitable company size and industry |
| Implementation Barriers | Whether it can be used immediately without setup |
| Conclusion | Determination of whether to prioritize cost or functionality |
Five Common Mistakes in Comparison Table Design
Here are five common patterns of mistakes in comparison table design.
Mistake 1: More Than 10 Comparison Axes
If there are too many comparison axes, the AI cannot filter information during extraction and is likely to be excluded from quoting. Please narrow it down to 5-7.
Mistake 2: Cells Contain More Than 3 Sentences
AI prefers information that is concise in 1-2 sentences. Long explanations should be separated and placed below the table.
Mistake 3: No Conclusion Row Exists
If the table does not contain a judgment on "which company to choose," AI cannot use it as a response.
Mistake 4: Comparison Tables Presented as Images or PDFs
AI crawlers cannot read text within images. Always use HTML table tags for presentation.
Mistake 5: Prerequisites Are Not Stated
Without prerequisites like "for companies with fewer than 100 employees" or "2026 edition," there is a risk that AI will quote in the wrong context.
The Relationship Between E-E-A-T and Comparison Tables: What Conditions Make Tables Trustworthy for AI?
When AI quotes comparison tables, the evaluation of E-E-A-T (Experience, Expertise, Authoritativeness, Trustworthiness) becomes an important criterion for judgment.
| E-E-A-T Element | How It Is Manifested in Comparison Tables |
|---|---|
| Experience | Include actual usage data like average operating rates over the past three years. |
| Expertise | Explain the rationale for selecting comparison axes in the text. |
| Authoritativeness | Clearly state author information and areas of expertise. |
| Trustworthiness | Include the source and update date of numerical values just below the table. |
Comparison tables that include actual data, such as "Company C, recommended with a satisfaction rate of 95% in the 2025 evaluation," meet both "experience" and "trustworthiness" criteria of E-E-A-T.
How to Combine Answer-First Writing Structure with Comparison Tables
To maximize AI quoting rates, wrap the comparison table in a structure of "Conclusion → Evidence → Details → Examples → Cautions."
Structure Template
- Conclusion (1 sentence directly under H2): "If cost is a priority, Company A is optimal; if functionality is a priority, Company B is optimal."
- Evidence (1 paragraph): Explain the prerequisites and subjects of the comparison.
- Details (Comparison Table): Place a decision axis comparison table.
- Examples (Supplementary Paragraph): Describe specific use cases.
- Cautions (1 paragraph): Clearly state the limitations and exceptions of the comparison table.
This structure allows AI to quote the conclusion statement as a response and the comparison table as evidence.
Comparison Table Update Strategy: How to Maintain Information Freshness?
Since AI values the freshness of information, regularly updating comparison tables directly correlates with maintaining quoting rates.
- Update pricing information quarterly (clearly state it as the 2026 edition).
- Update performance data like operating rates and satisfaction rates annually.
- Add new services to the comparison when they are introduced.
- Clearly state the update date just above the table, such as "Last updated: May 2026."
The more frequently updated the comparison table is, the more likely AI will refer to it as "reliable and up-to-date information."
Checklist for Comparison Table Design
Before publishing the comparison table, please check the following 15 items.
- Are the comparison axes narrowed down to 5-7?
- Are each cell concise in 1-2 sentences?
- Is the conclusion row included in the table?
- Is it written using HTML table tags?
- Is the header row defined using the thead tag?
- Are accurate values input into the td tags?
- Are prerequisites (target company size, year) clearly stated?
- Is structured data (such as Product schema) implemented?
- Is the reading method for comparison axes explained in the text?
- Is the table presented in text rather than as an image or PDF?
- Is author information included in the article?
- Is FAQ structured data implemented?
- Is the update date stated just above the table?
- Is rating information embedded using AggregateRating?
- Is there a pathway from the table to related pages?
The Relationship Between Comparison Tables and Other LLMO Measures
Comparison tables do not work effectively on their own; they must be linked to the overall LLMO strategy to maximize quoting rates.
| LLMO Measure | Relationship with Comparison Tables |
|---|---|
| Answer-First Writing | Place the conclusion statement just before the comparison table. |
| Question-Form Headline Design | Place the comparison table under H2 like "Which service is suitable?" |
| FAQ Structured Data | Add questions related to the comparison table to the FAQ. |
| Internal Link Optimization | Link from the comparison table to individual service explanation pages. |
| Clear Author Information | Ensure the expertise of the comparison is guaranteed. |
Conclusion: Design Criteria for Comparison Tables Quoted by AI Search
Comparison tables are a highly quotable format in AI search, but they will not be quoted without "design for decision-making materials."
Let’s summarize the conditions for comparison tables to be quoted:
- Narrow down comparison axes to 5-7 and make each cell concise in 1-2 sentences.
- Clearly state conclusions like "If cost is a priority, Company A is optimal; if functionality is a priority, Company B is optimal."
- Write using HTML table tags and define headers with the thead tag.
- Add structured data for Product schema and 2026 edition pricing information.
- Ensure reliability by embedding rating scores using AggregateRating.
- Clearly state prerequisites like implementation costs for companies with fewer than 100 employees.
- Include performance data based on average operating rates over the past three years.
Moving away from functionality checklists and designing comparison tables that support user decision-making is the fundamental strategy for gaining quotes in the AI search era of 2026.
Frequently Asked Questions (FAQ)
Q1. Are comparison tables more likely to be quoted by AI if they have more items?
No. The optimal number of comparison axes is 5-7. If there are more than 10 items, the AI may struggle to filter information and is likely to be excluded from quoting. Focusing on important axes allows the table to remain meaningful even when partially extracted by AI.
Q2. Is the comparison table sufficient on its own? Is the text unnecessary?
The comparison table alone is insufficient. Explaining how to read the comparison axes, stating prerequisites, and supplementing conclusions in the text can prevent misinterpretation by AI while increasing quoting rates. Design the table and text as a set.
Q3. Should pricing comparisons be included in the same table?
It is recommended to include pricing as one of the comparison axes in the same table. However, clearly state that it is the monthly cost for the 2026 edition and also mention any functionality differences between annual and monthly contracts.
Q4. Will comparison tables created as images be quoted by AI?
No, they will not be quoted. AI crawlers cannot read text within images, so always write using HTML table tags. PDFs are similarly excluded from quoting.
Q5. Is structured data mandatory? Can it be quoted without it?
While it is possible to be quoted without structured data, implementing Product schema and FAQ structured data allows AI to accurately understand the meaning structure of the table, improving quoting accuracy.
Q6. How often should comparison tables be updated?
It is recommended to update pricing information quarterly and performance data like satisfaction and operating rates annually. Clearly stating the update date just above the table will lead AI to prioritize it as "reliable and up-to-date information."
Q7. Is the design of comparison tables different for BtoB and BtoC?
Yes, it is different. In BtoB, practical judgment axes such as "implementation period," "operational load," and "compatibility with existing systems" are important. In BtoC, intuitive judgment axes like "price," "ease of use," and "customer reviews" are effective.
Q8. Is it acceptable to include competitors' names in the comparison table?
It is permissible to include them, but limit it to objective comparisons based on facts. Subjective evaluations of superiority or baseless negative expressions can undermine credibility and lead to exclusion from AI quoting.
Q9. What is the most important point to make comparison tables more likely to be quoted by AI?
Adding a conclusion row is crucial. Clearly stating a conclusion in one sentence, such as "If cost is a priority, Company A is optimal; if functionality is a priority, Company B is optimal," significantly impacts AI quoting rates.
Q10. If comparison tables are hard to read on smartphones, how should I respond?
Please use responsive HTML tables. Designing them to be horizontally scrollable or narrowing down comparison axes to create a vertical table can enhance readability on mobile while making it easier for AI to extract information.